My Jenkins build isn't triggering when I push
We started receiving reports that our main production Jenkins instance was not triggering jobs when people pushed new commits in GitHub

In this post I will take you through an issue that plagued us for about 6 weeks. Preventing builds starting automatically from webhooks. I will show you the troubleshooting process and the learnings along the way of how all this worked.
We started receiving reports that our main production Jenkins instance was not triggering jobs when people pushed new commits in GitHub
We've had issues before when GitHub webhooks weren't being delivered so at first it was just put down to an issue with GitHub. In the mean time users were being asked to workaround it by manually triggering their builds and using the 'Scan repository' functionality in Jenkins to make new pull requests show up in the multi-branch pipelines we use.
This wasn't good for our users though, they had to remember to manually trigger builds after every push which caused delays to their work. Lots of scanning of repositories also caused us capacity issues due to more builds being triggered than needed which added more delays to our users.
Initial investigation
The first place we started looking was are the events being delivered. We have a webhook setup at the GitHub organisation level to send these events to Jenkins. GitHub was reporting everything fine.
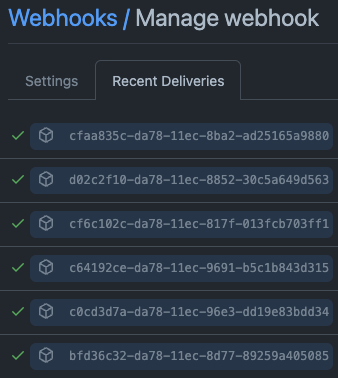
The next level was Jenkins, by searching for PushEvent in the logs we could see events were arriving fine:
2022-05-23 09:18:39.142+0000 [id=1078310]	INFO	o.j.p.g.w.s.DefaultPushGHEventSubscriber#onEvent: Received PushEvent for https://github.com/****/***** from 140.82.115.93 → 10.10.72.35 → 140.82.115.93 ⇒ https://jenkins/github-webhook/
2022-05-23 09:18:39.324+0000 [id=1035877]	INFO	o.j.p.g.w.s.DefaultPushGHEventSubscriber#onEvent: Received PushEvent for https://github.com/****/***** from 140.82.115.96 → 10.10.72.4 → 140.82.115.96 ⇒ https://jenkins/github-webhook/
Interestingly enough that log line isn't from the event processing we are interested in, time to do some research into how this works.
How does event processing work
The Jenkins GitHub plugin provides an extension point for subscribing to GitHub events. The above logs are an example of one subscribing to push but not the one we are after. The plugin we are interested in is the GitHub Branch Source plugin which provides an SCM source to Jenkins that we can use for Organisation folders. Looking at the implementors of the event subscription extension point. We can see one that looks to be the most likely PushGHEventSubscriber.
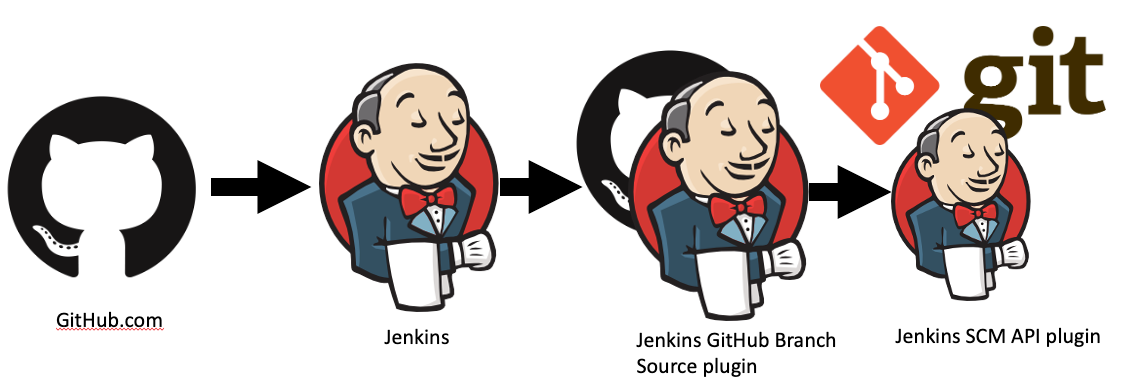
Reading through the code you can quickly see that this subscriber just relays the events to another API. It calls a method named fireAfterDelay. Which then calls SCMHeadEvent.fireLater which is part of the SCM API plugin.
Looking at SCMHeadEvent.fireLater you'll see the event processing is scheduled with an Executor service which is hardcoded to a maximum of 10. Hmm that's interesting 10 threads for processing which doesn't scale based on instance size.
The next step was to try gain some insights into how the thread pool was performing. ThreadPoolExecutor has a very useful toString() method that outputs information on how it's performing.
Running: jenkins.scm.api.SCMEvent.executorService in the Jenkins script console shows:
Result: java.util.concurrent.ScheduledThreadPoolExecutor@8b0291b[Running, pool size = 10, active threads = 10, queued tasks = 2000, completed tasks = 21888]This shows a very high number of queued tasks, which is likely our issue. At about this point we created an upstream issue to see if we could get any input from others JENKINS-68116 Slow processing of multi branch events.
What next
There were logs in /var/jenkins_home/logs but they weren't very useful as you couldn't correlate them back to an event and they had an extremely low retention time which gave us around 10-15 minutes of logs.
We had a few ideas of what to do next:
- Make the executor size configurable
- Change the logging configuration to retain logs for longer and then do further analysis
- Filter out webhooks from repositories that will never match
One idea came from the issue we opened to use GitHub topics to explicitly opt each repository in rather than using regex filtering.
Experimenting
The first idea we tried out was changing the thread pool size. We started with 20 and then went up to 40. This made a massive difference and initially we thought this may be enough although not a great fix as it was throwing resources at the problem but not fixing the underlying cause.
Checking the queue every now and then was showing much better results, but after a couple of days we started getting reports of the issue reoccurring, and checking the queue at the time showed that there was around 1500 queued. Okay, not fixed but we were in a better position than before.
Let's gather some data, JENKINS-68116 Increase log size limit was created to increase the logs. This helped provide some information. There was no correlation to tie events to log statements though, a pull request was hacked together (although never cleaned up for merging) that added a correlation ID that could be used when searching the logs.
This was easier to do analysis on. We could ask questions like:
- Which repositories are sending the most events
- How long is each event taking to process
- At which stage in the process is the time being lost
The repositories with the most events were mono-repos for our GitOps configuration, these don't even build on Jenkins but they do match the regex filters.
To prototype filtering of events before Jenkins processes them we decided to just drop them at our reverse proxy to see if it made any difference. After monitoring for a couple of days this didn't seem to help.
After some discussion it was brought up that we didn't have enough observability on the affect of our changes, we could manually query the state of the executor service but didn't have any historical data or integration of it into our performance monitoring tool. Before making any more changes we wanted to get some observability.
Observability
There are two main options for exporting observability in Jenkins:
- Prometheus metrics plugin - based on Dropwizard metrics
- OpenTelemetry plugin
OpenTelemetry is a modern standard that provides tools, APIs and SDKs for exporting telemetry data (metrics, logs and traces).
Many tools are integrating with OpenTelemetry now including the APM tooling we use (both Application Insights and Dynatrace APM).
After looking at both we selected the OpenTelemetry plugin as the most suitable observability solution.
We provided an implementation upstream that we tested internally first, Export metrics for SCM Event queue (OpenTelemetry plugin) and Export metrics for scm event queue performance (SCM API plugin). We then deployed our changes and used the OpenTelemetry collector to relay traces and metrics to Dynatrace APM.
We were able to build a dashboard that showed how many queued events there were over time:
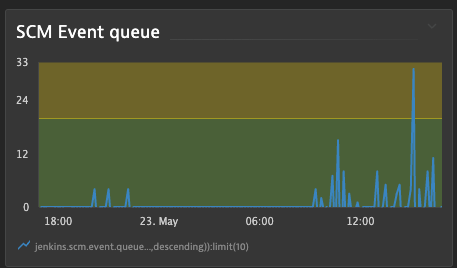
Now we have some observability in place let's go back to making changes.
Back to trying things out
We set Jenkins up locally to step through the SCM event processing code. One interesting step stood out, for each Organisation folder there would be a GitHub API call made to try retrieve the GitHub repository. After running a few hundred requests to this endpoint we determined that the average response time was about 280 ms for this particular API call but it did range between 250 ms and 500 ms.
Doing some maths and comparing to the earlier log data we found this matched to generally about 70% of the time being spent in the queue. There was some time that wasn't accounted for when some requests took 80 to 120 seconds to process (we never tracked this down unfortunately).
At the time we had 68 organisation folders which meant that we were always going to spend at least 20 seconds processing each event.
We looked at changing the API call in Jenkins to use GraphQL to only request the required information and hopefully increase the performance, but the library used for interacting with GitHub has had a feature request open since 2019 and doesn't support it currently. Since we looked into this there has been a bit of activity on it and it has been suggested that you can use a different library for the GraphQL bit, which someone could investigate in the future for optimising the Jenkins side.
The reason we had all these organisation folders was so that we could spread rate limits across different accounts back when we had only 2000 calls per hour to GitHub allowed. GitHub apps changed this and gave us 15,000 calls per hour. So we wondered if we could just remove all these organisation folders and go back to just one.
Combining folders
Topics were adjusted using some script console queries to get the required jobs and then GitHub CLI commands to adjust the topics.
We then deleted all existing folders and created a new one for the whole organisation (all managed by JobDSL).
This didn't go to well, jobs started hanging for no obvious reason. After some restarting of Jenkins and troubleshooting we identified that our rate limiting budget had run out and the GitHub checks plugin was trying to update GitHub with information about the build, this was just sleeping with nothing communicating what was going on. We disabled the progress updates while the build was running which helped, but we still had issues and it took a long time for a new job to be picked up in an org scan.
We decided to create a few GitHub apps and split the folders into 3. We did this alphabetically for simplicity, balancing among letters with the most GitHub repositories. After splitting the folders the performance and rate limiting issues were resolved.
Afterwards we found some of our scanning issues was down to poor repository hygiene, a number of repositories had over 300 stale branches, and we found one with 1100. Jenkins had to check each branch to see if it matched the folder configuration on a scan. This is what caused our rate limit budget to go so quickly. Previously we didn't notice this sort of thing as folders were split into teams and didn't affect other teams, but now the folders are multi-tenanted so the repository hygiene is more important.
Preventing recurrence of rate limiting issues
Following on from the earlier theme of observability we wanted to be able to monitor the GitHub rate limit of each of our applications. We raised an issue with the OpenTelemetry plugin to discuss the possibility of this. One of the maintainers @cyrille-leclerc quickly created a pull request which we tested a few iterations of and once it was working deployed it to our production system and updated our dashboard.
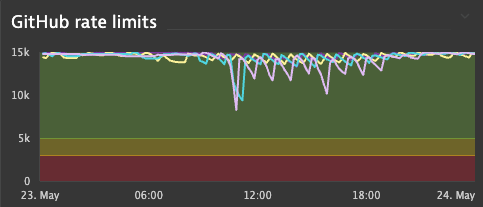
We are able to conclusively say that we are not running out of rate limit any more. At busy times we do still use quite a bit, but now we have the observability in place we can easily monitor it.
Summary
If you've made it this far well done.
During this journey we learned a lot about how the SCM events work and about OpenTelemetry.
We now have much better observability of our Jenkins instance.
Hopefully this helps someone else one day.